

SITCOMTN-100
The Rapid Analysis Framework and its relationship to RubinTV#
Abstract
The Rapid Analysis Framework (RA) is the realtime processing system which runs as a set of Kubernetes pods at the summit, USDF and the test stands, turning raw telescope exposures into images, plots, metrics and metadata as they are taken. RubinTV is the separate web frontend which displays much of that output, and the two are routinely confused. This technote describes the architecture and motivation of RA in detail - its work distribution model, its full focal plane processing, and the various “snowflake” services which have been written from scratch for it - and then describes RubinTV and the precise boundary between the two systems, at the level of detail needed to understand what each does and where one ends and the other begins.
Preamble (aka. Merlin’s soapbox)#
This technote is both a work-in-progress, because
it is a provisional version which won’t be tidied up until after the design review
it is documenting a moving target, meaning that there are places where the present tense is used to save having to write everything twice, but where the work hasn’t quite been done yet. These are, however, all places where the work is planned and underway, i.e. it’s not aspirational, it’s just not quite finished yet, but will be done on the scale of weeks.
There are many ways to skin a cat. This is how it is currently being done, but nothing in here should be taken as an assertion that this is how it should be being done, merely that this is how it is at present. It is, however, also worth nothing that without significant intervention and extra effort allocated, it will remain that, due to the limited nature of the allocated effort and the enormous scope of work remaining.
It is perhaps also worth keeping in mind that the initial architecture was conceived and deployed a) organically i.e. as it was required and b) that it came into being in January 2020 with the delivery of LATISS to the summit, so if you find yourself thinking “why doesn’t it look like/use X”, recall what the DM landscape was like back then, and what existed in terms of leverageable architectures. Given that, I think it’s quite surprising how not bad it all is. Of course, YMMV…
Introduction#
Historically, there has been confusion about what Rapid Analysis is, what RubinTV is, and what the relationship and boundaries are between the two. This is because they were developed at the same time, co-evolving with one another. However, they are entirely separate, and totally decoupled, in the technical sense. Therefore, we begin with definitions of each, paying careful attention to say exactly what each is, and is not. This technote will provide a detailed description of, and motivation for, the Rapid Analysis Framework, but does not go into depth about the workings of RubinTV - that will be covered in enough depth to make it clear what it is and where the boundaries are, but no more than is necessary that. It is also worth nothing that some of this confusion came from some poor naming choices made as the co-evolution of Rapid Analysis and RubinTV was ongoing, almost all of which have now been rectified, with the only item remaining to be fixed being that the RA framework still lives in a repo called rubintv_production[1].
What Rapid Analysis is/isn’t#
Rapid Analysis (RA) is a realtime processing framework. Its customers include commissioning scientists, observers, Telescope & Site personnel including AOS, and during early commissioning, science pipelines folk, and anyone wanting to see what’s happening on the summit in realtime and/or have a general situational awareness of what’s happening on the summit and how the data-taking is going. It is a set of Kubernetes pods and a work distribution system which runs in various locations, processing data in realtime. Currently, these locations are:
On the summit
At USDF
On the BTS (for bi-directional testing)
On the TTS (for bi-directional testing) where “bi-directional testing” means it is there so that we have a test environment where we can test RA itself, but that it is also running as a deployment, processing the test stand data as it is “acquired”, in order to support the data acquisition and testing that the test stands themselves provide.
RA is not deployed via phalanx. It is administered via ArgoCD, and the repo which defines the pods and their memory/CPU allocations is here.
Rapid Analysis has several outputs:
it
butler.put()s its outputs to the relevant local repoit writes per-exposure, per-visit and per-detector summary statistics and metrics to the consolidated database (ConsDB). This is what is referred to throughout this technote as the Summit/Visit Database - it now exists and is being populated (via
ConsDBPopulator), though not every service has been wired up to it yetit sends files to local and remote S3 storage so that data can be displayed on RubinTV
What it is not/does not have:
it has no frontend
it does no display of anything
In the future it will send data on its health and processing status to LOVE for display.
Because it does render pngs and writes them to an S3 bucket of which RubinTV is a consumer, the package used to be called rubintv_production, but is in the process of being renamed to rapid_analysis (which, ironically, is what it was called originally, before I was told to rename it).
A principle of RA is to process things as quickly as possible, and when it is unable to keep up (for whatever reason), to only process the most recent image for a given data stream, i.e. to prioritize staying present and leaving gaps in the data over having all images processed and falling behind. Some catchup services exist, on a best-effort basis, and to-date they have not saturated, but no guarantees are made with respect to the completeness of processing[2]. Details on how this is dealt with are given later the section on full focal plane processing
What RubinTV is/isn’t#
RubinTV is a python web app deployed via Phalanx. It is entirely decoupled from Rapid Analysis in the sense that the two share no code and make no direct calls to one another: the bulk data flow is strictly one-way, from RA to RubinTV, via S3[3]. There is, however, a thin control/status side-channel over Redis (RA publishes its cluster status, and RubinTV’s admin page publishes control commands back to RA) - this is described in the section on the boundary between RA and RubinTV. To date, everything displayed on RubinTV has been processed and uploaded via RA, but there is nothing that necessarily makes that the case. There are significant plans for data display (the Derived Data Visualization work) that will use RubinTV as frontend, and that will display data which will not have been produced by RA, e.g. EFD data.
The RubinTV web app code lives here, and has been officially adopted by T&S. It is now deployed via Phalanx, which was necessary for authentication in order to be embargo-compliant.
There are two RubinTV sites for each location, a dev and a prod site.
What RubinTV is not:
RubinTV does no processing of anything
Once the Derived Data Visualization code is integrated, it will retrieve data for plotting from:
The butler
The EFD
The Summit/Visit Database
How RubinTV works#
The detail of RubinTV’s internals is out of scope here, but a sketch is useful for understanding the boundary. RubinTV is a single-replica FastAPI application, and it is strictly read-only with respect to data: it never writes to S3, it only reads what RA (or, in the future, other producers) have put there. It finds data by polling - a current-day poller lists the relevant S3 prefixes roughly once a second so that the night’s data shows up essentially live, and a separate historical poller scans older dates much less frequently and caches the result. New and changed objects are pushed to the browser over WebSockets, where a React frontend renders the tables, images, movies, mosaics and night reports. Each deployment only ever sees its own location’s data, except at USDF where it is the superset (the per-location split, and USDF’s superset, are described in the history section below).
The only other thing RubinTV touches is Redis, and only for two narrow purposes: it reads RA’s cluster-status streams in order to draw the detector-status page, and its admin page reads and writes the RA control keys (with read-back) described in the processing control section. It does no processing of any kind.
The history (and thus the shape) of RubinTV#
This section will be deleted, but some background that may be relevant to the review:
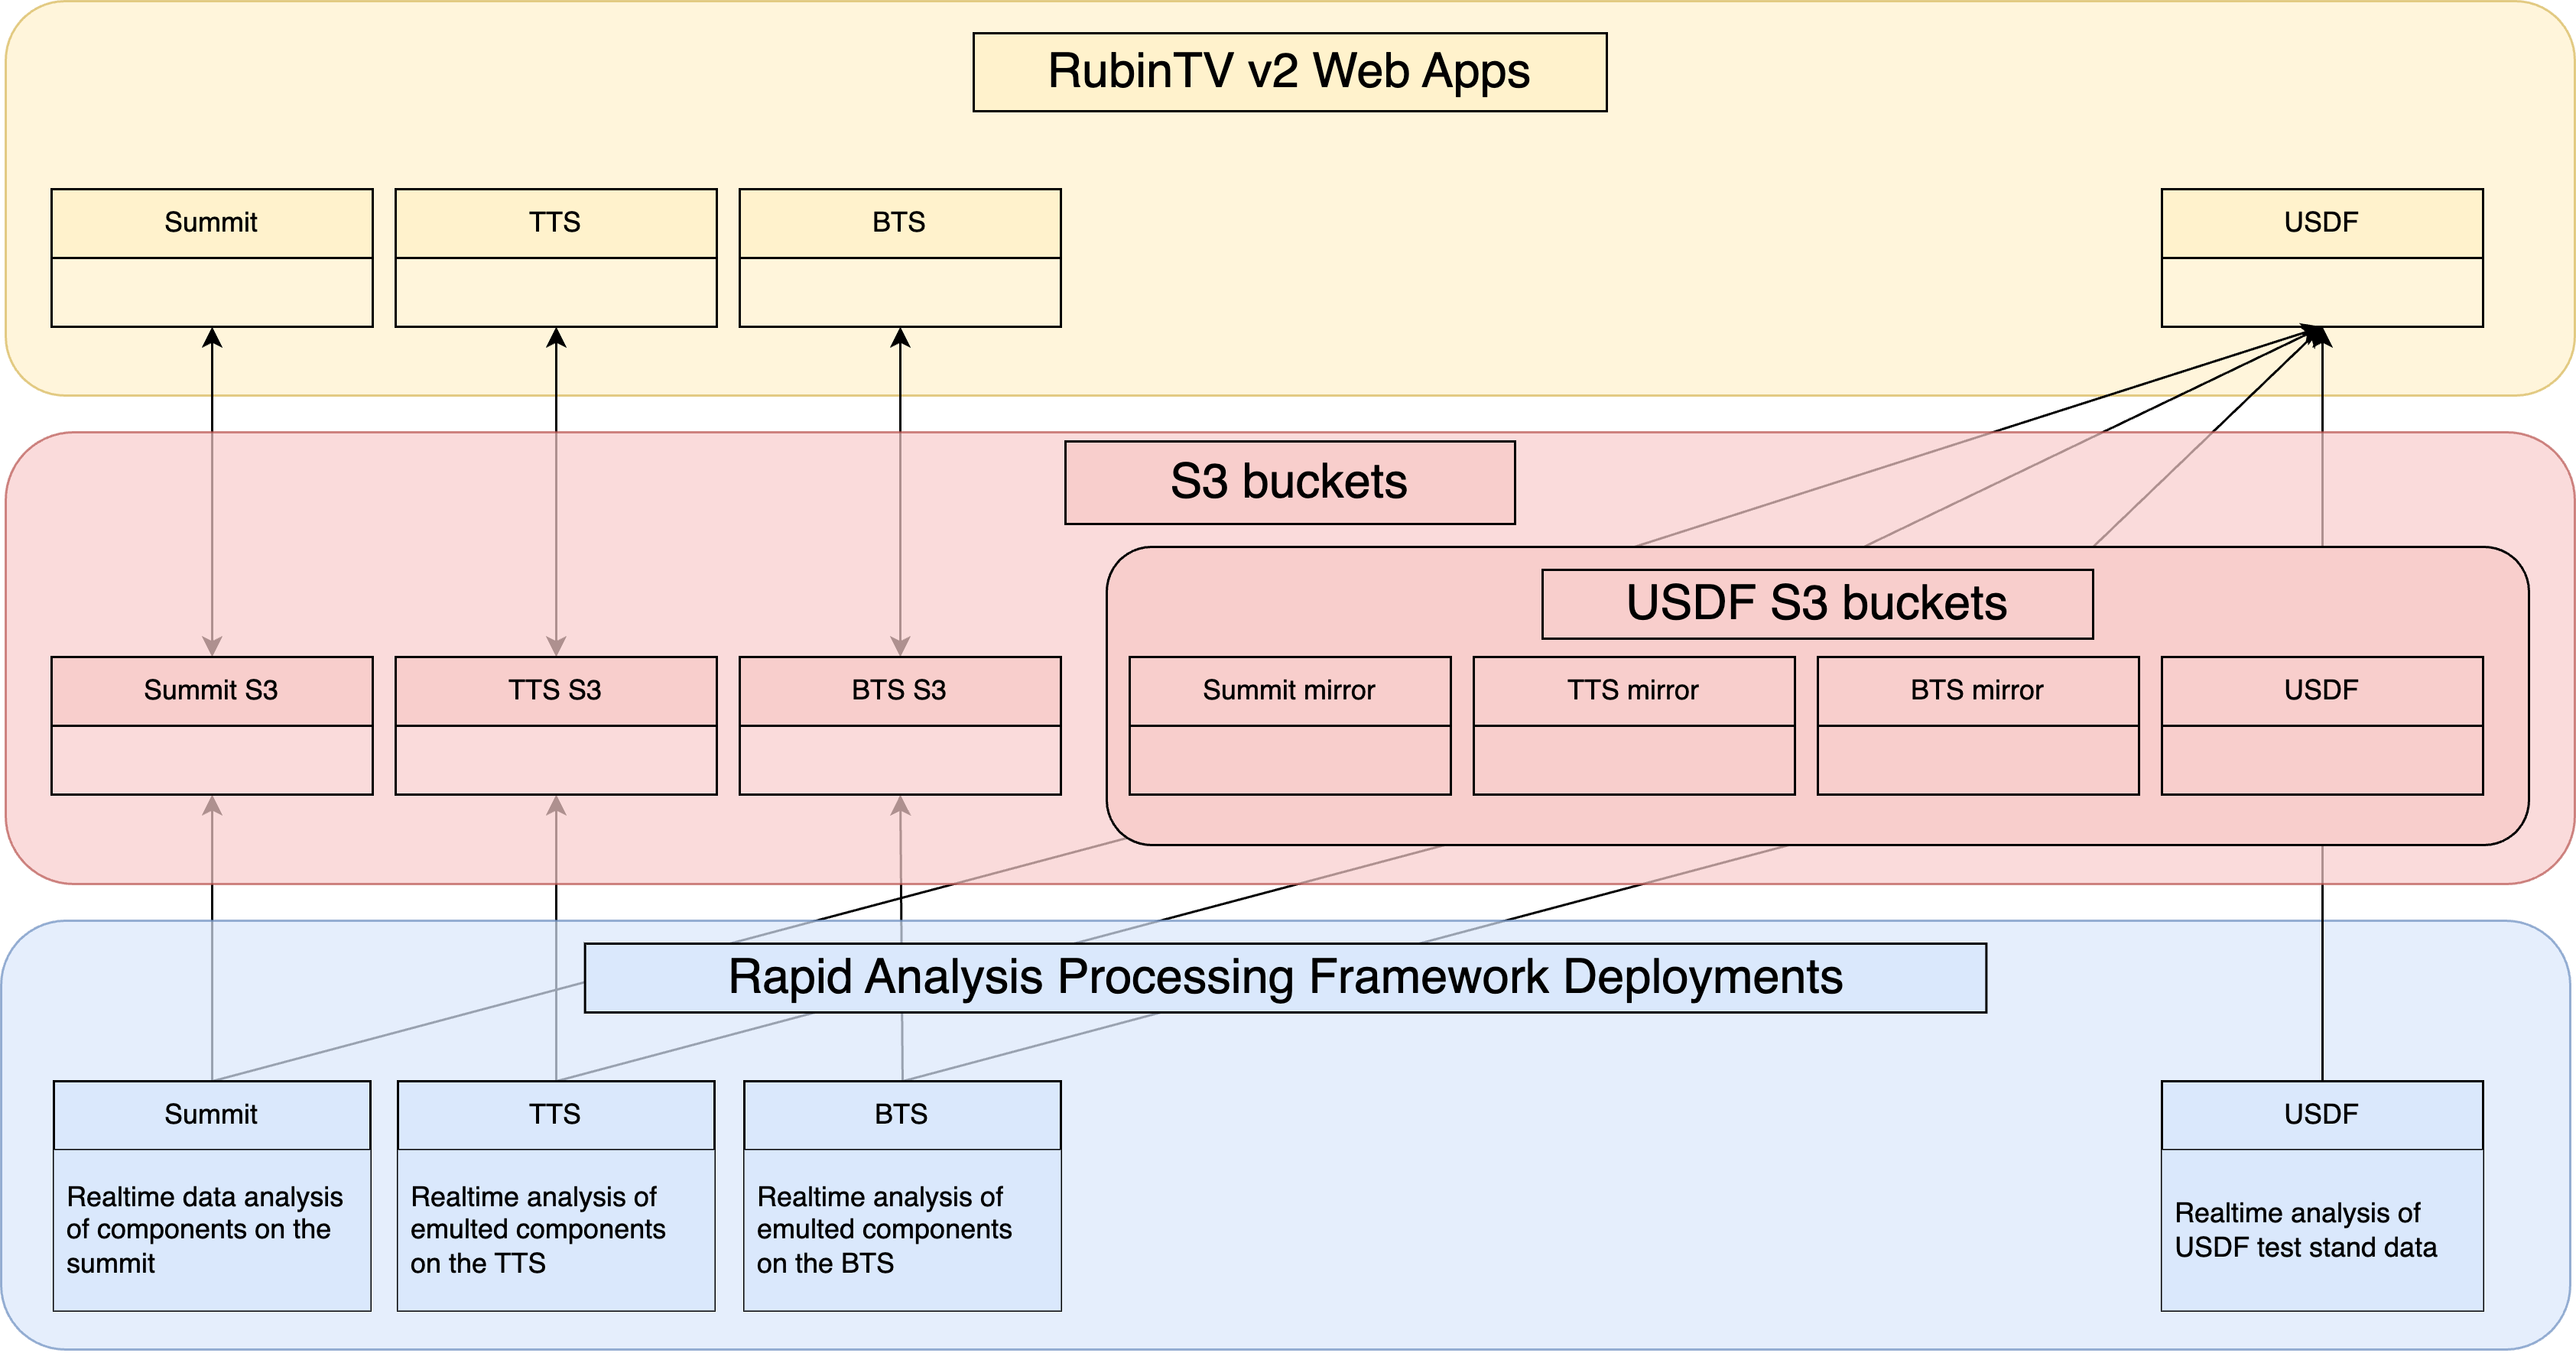
Simon helped us put together the initial web app, and thus it was born in the SQuaRE org, and used saphir. When it needed to move beyond a web 1.0 hand-crafted html design, I employed Guy Whittaker as a web dev so that I didn’t have to learn how to make websites. This initial version was deployed on Roundtable, and stored all its data in GCS. The summit data lives in the rubintv_data GCS bucket, with rubintv_data_tts and rubintv_data_usdf existing to store data from the TTS and USDF respectively. All these were served from a single frontend, which had various locations selectable from the front page, which then told the app which bucket’s data to display.
When it became clear that RubinTV was going to live long term, and that its contents would be subject to embargo compliance, v2 was written, which brought about several changes. Firstly, it moved from Roundtable deployment to phalanx. It changed frameworks from saphir to FastAPI, and moved from GCS storage to being S3 backed, so that we could self-host the data to be embargo-compliant. This move to S3, plus the need to have the summit display be resilient to network outages, necessitated a change in how the web app is deployed and backed. It is therefore now: one S3 bucket per (non-USDF) location, with two web app instances (dev and prod), with each web app hosting the data from its own location, i.e. the summit instance shows the real summit data, the TTS deployment only shows emulated data from the TTS, and likewise the BTS shows emulated BTS data only, too. The USDF-hosted web app breaks the pattern, by being the superset of all locations: there are four S3 buckets at USDF: three which are mirrors of the other buckets (summit, TTS and BTS), and a local bucket containing USDF’s own data (data created from full camera cleanroom testing, and which continue being generated at USDF for TS8 data). The USDF web apps therefore still have a selectable location, whereas the per-location sites will not, as they only have access to their local data.
Where will Rapid Analysis run in the future?#
When we hit steady-state operations, the intention is for RA to be deployed:
On the summit, to process the real data
On the TTS and BTS, to process their simulated data streams, which has two purposes:
To have a place to test the RA framework/deployments before deploying on the summit
To support data taking/simulation on the test stand itself
At USDF, to process TS8 data only
That is, there is no intention of keeping RA deployed and running at USDF to process any on-sky or summit data once the camera ships, and that the only deployment at USDF would then be a small one, at the request of the camera team, to allow them to monitor data taking on TS8 in realtime on RubinTV - an activity which is expected to continue indefinitely. The summit’s non-pixel-based outputs, i.e. the rendered pngs, movies, and metrics etc will be being mirrored at USDF, for analysis and display via RubinTV, but reproducing the processing itself will likely not be necessary. It is worth noting that if it would be desirable to deploy RA at USDF for some reason, that this would be trivial, but it is not intended to be the case, nor currently thought to be necessary.
The boundary between RA and RubinTV#
It is worth stating the boundary explicitly, in one place, because this is exactly what has historically caused the confusion. RA and RubinTV share no code, and make no direct calls to one another. They are coupled at exactly two places, both of which are conventions rather than interfaces:
S3 object keys. RA writes plots, images, movies and metadata into S3 under a strict, agreed key convention (
{camera}/{dayObs}/{channel}/{seqNum}/{filename}, plus a per-daymetadata.jsonper camera). RubinTV discovers everything it displays purely by listing and parsing those keys. Nothing else connects the producer to the consumer - if RA writes a correctly-named object, it appears on RubinTV, and if it doesn’t, it doesn’t. This naming convention is the contract.Redis keys. A handful of named Redis keys carry cluster status from RA to RubinTV (so it can draw the detector page), and control commands from RubinTV’s admin page back to RA (AOS pipeline selection, chip-selection pattern, processing mode, head-node reset, and so on), each with a read-back key so that the operator can confirm the command was actually consumed.
So the data-products flow is genuinely one-way (RA produces, RubinTV displays), but there is a deliberate, narrow control/status side-channel over Redis going the other way. That is the entirety of the relationship: two well-known sets of key names, and otherwise two completely independent systems which happen to have co-evolved. Everything else people tend to assume connects them (shared databases, direct API calls, shared deployment, one importing the other) simply does not exist.
What are summit_utils and summit_extras?#
A quick note here about the packages, why they live in the SITCOM GitHub org and not in the lsst_distrib metapackage, but instead in lsst_sitcom.
These packages break telescope agnosticism, and thus are not allowed in the core DM/Science Pipelines codebase. I initially pushed for this, but understood the point that this code simply does not belong there. It also contains code which people don’t like/object to (often because it’s not pipeline-like), but which needs to exist, regardless. It also contains a lot a lot of syntactic sugar/one-line-makers to make things easier for summit/commissioning folk (who are not (pipeline) developers).
In summit_utils, the test coverage is excellent, and nothing should be added there without adding test coverage. These tests are all run in Jenkins, either as unit tests (where possible), or via the ci_summit package when unit testing isn’t possible. ci_summit runs as part of the nightly build, as well as being available on request. In some sense, bugs and breakages here should be considered worse than in Science Pipelines (if such a thing is even permissible to say!), and code should therefore be as, or even more, carefully tested. This is because problems here can directly result in lost telescope time or observing inefficiency, as code in here is relied upon by the scheduler and other closed-loop T&S operational code.
The summit_extras package, however, is not like this. It is a place for adding useful code which should live in one place (for all the obvious reasons - passing functions around notebooks is Very Bad, I’m sure we can all agree) but which should explicitly not be relied upon for anything important, operational of scientific[4].
Why Rapid Analysis != Prompt Processing Framework != OCPS#
Soapbox section: First and foremost, Rapid Analysis is a pragmatic, “let’s say yes/make things happen” arena. That’s an odd things to say though, so why am I saying it? There are a large number of brilliant, hardworking scientists working on the summit/elsewhere to commission the system, and many of them are frequently blocked by needing various things to exist which simply weren’t planned (at least with respect to data processing and software support), and which, if we stopped to do things the way we’d all like them to be done, would result in significant (read: multiple months) of critical path delays. The point here is that this is real, important stuff, and while saying “we should have done it like X” is definitely a valid point, it needs to price in questions like “would you still say that if someone said it was a critical path activity and doing it that way would delay the activity by ~2 months?”.
The overwhelming majority of Rapid Analysis pods will (once the main camera is taking data) be for processing the full focal plane data via Single Frame Measurement. However, when counting by either pod-type or by code line-count[5], the vast majority of Rapid Analysis’ deployed services are actually “snowflake services” - realtime processing services for things which have been written from scratch to support a specific non-SFM use-case[6].
Things in the snowflake services are not (and could never be) pipelineTasks because:
Some data is not ingested - in these cases RA is working on raw files, i.e. there is no
butlerinvolvement. Examples include:StarTracker data
All sky camera images
TMAEventsMore to come, I am sure…
Some services contact the EFD and summit/visit database
This involves writing to and reading from the visit/summit database (i.e. it can’t just be fired off as a one-shot metric, it needs a live database connection)
Speed considerations:
Starting python and executing
import lsst.*spin-up time (~20s when last measured)Quantum graph generation delay (used to be about 15s for a single LATISS image when I last timed it, but this was a long time ago and this may now be OK - I don’t want to make false accusations - but calibs used to make things bad even for trivial output graphs)
Calib caching in the running process (saves ~5s for a full set of calibs)
Many things do not and cannot have a
next_visitevent as a trigger (CCS images, StarTracker/all sky data,TMAEventsetc)We need to control the behavior when we can’t keep up
Summit compute is not elastic the way PP is - RA downsizes processing when images acquisition cannot be kept up with, whereas PP expands to cope with load. See the Processing Control section for details on how this is handled.
For non-snowflake processing, i.e. regular full focal plane SFM type processing, it’s also worth noting that the post-SFM visit-level (step1b) step needs special handling to enable its use as a realtime service - see the Full Focal Plane Processing section for details.
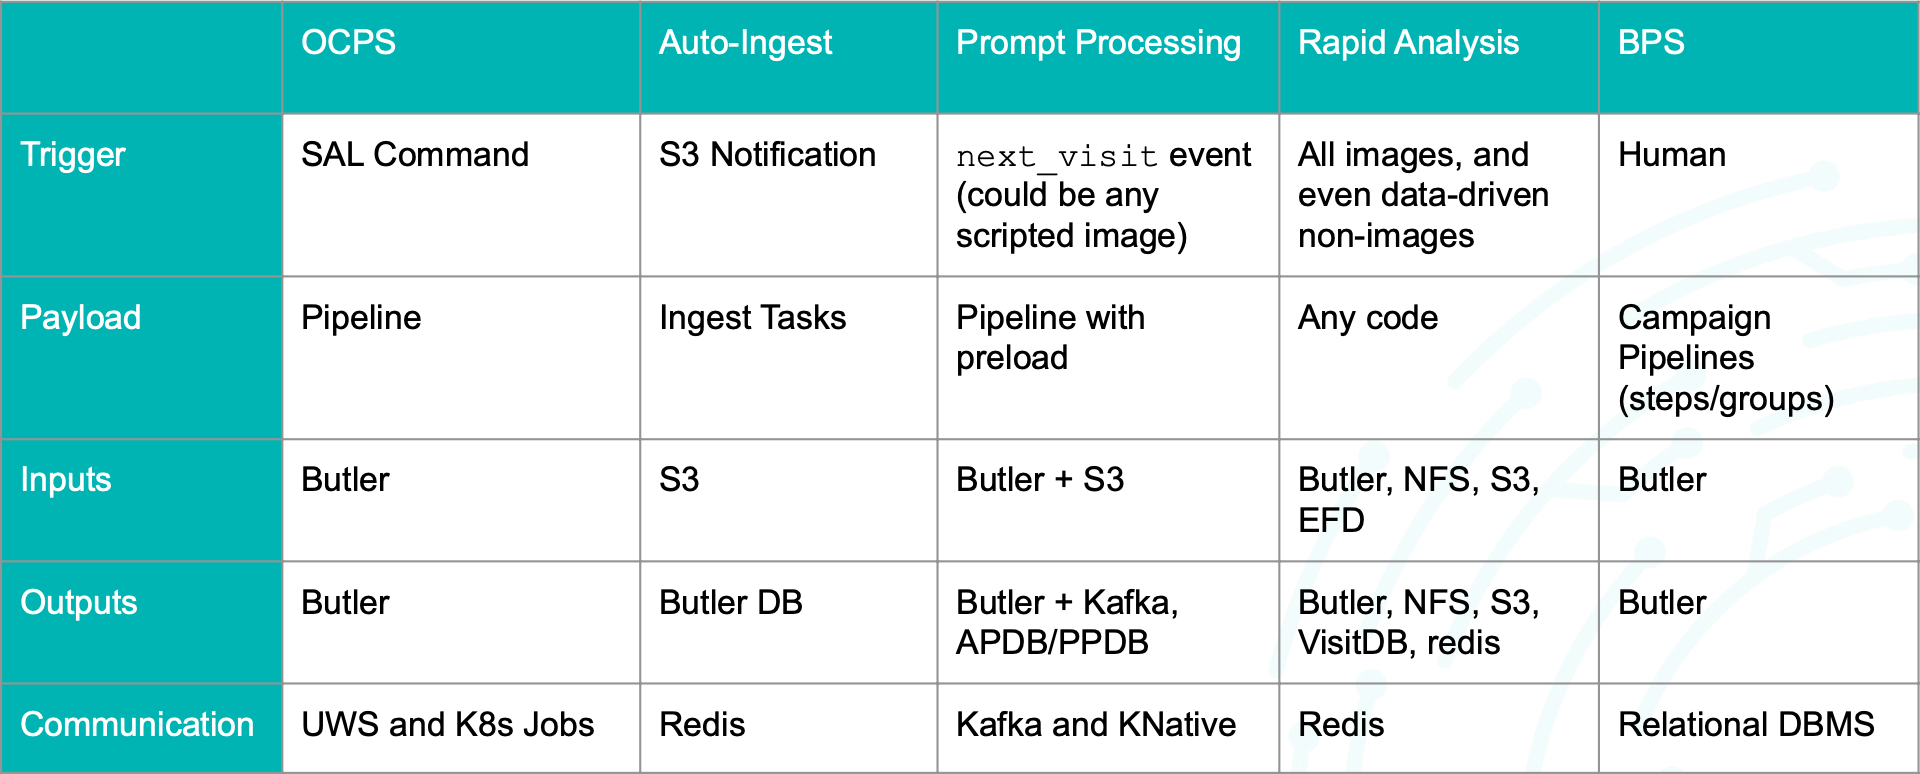
As shown in the comparison table, the various different processing mechanisms have different triggers, payloads, inputs, outputs and communication protocols. Auto-ingest is the most similar to RA, and in fact, the two will likely be combined in some way in the future.
Rapid Analysis Services#
The snowflake services are all services which have been written from scratch for RA and are not just thin wrappers around SFM. The SFM pipeline pods are covered in the Full Focal Plane Processing section, which covers the processing of on-sky images for LSSTCam, LSSTComCam and LATISS via SFM (LATISS, when taking survey images, is also “full focal plane processing”, it just has a single chip).
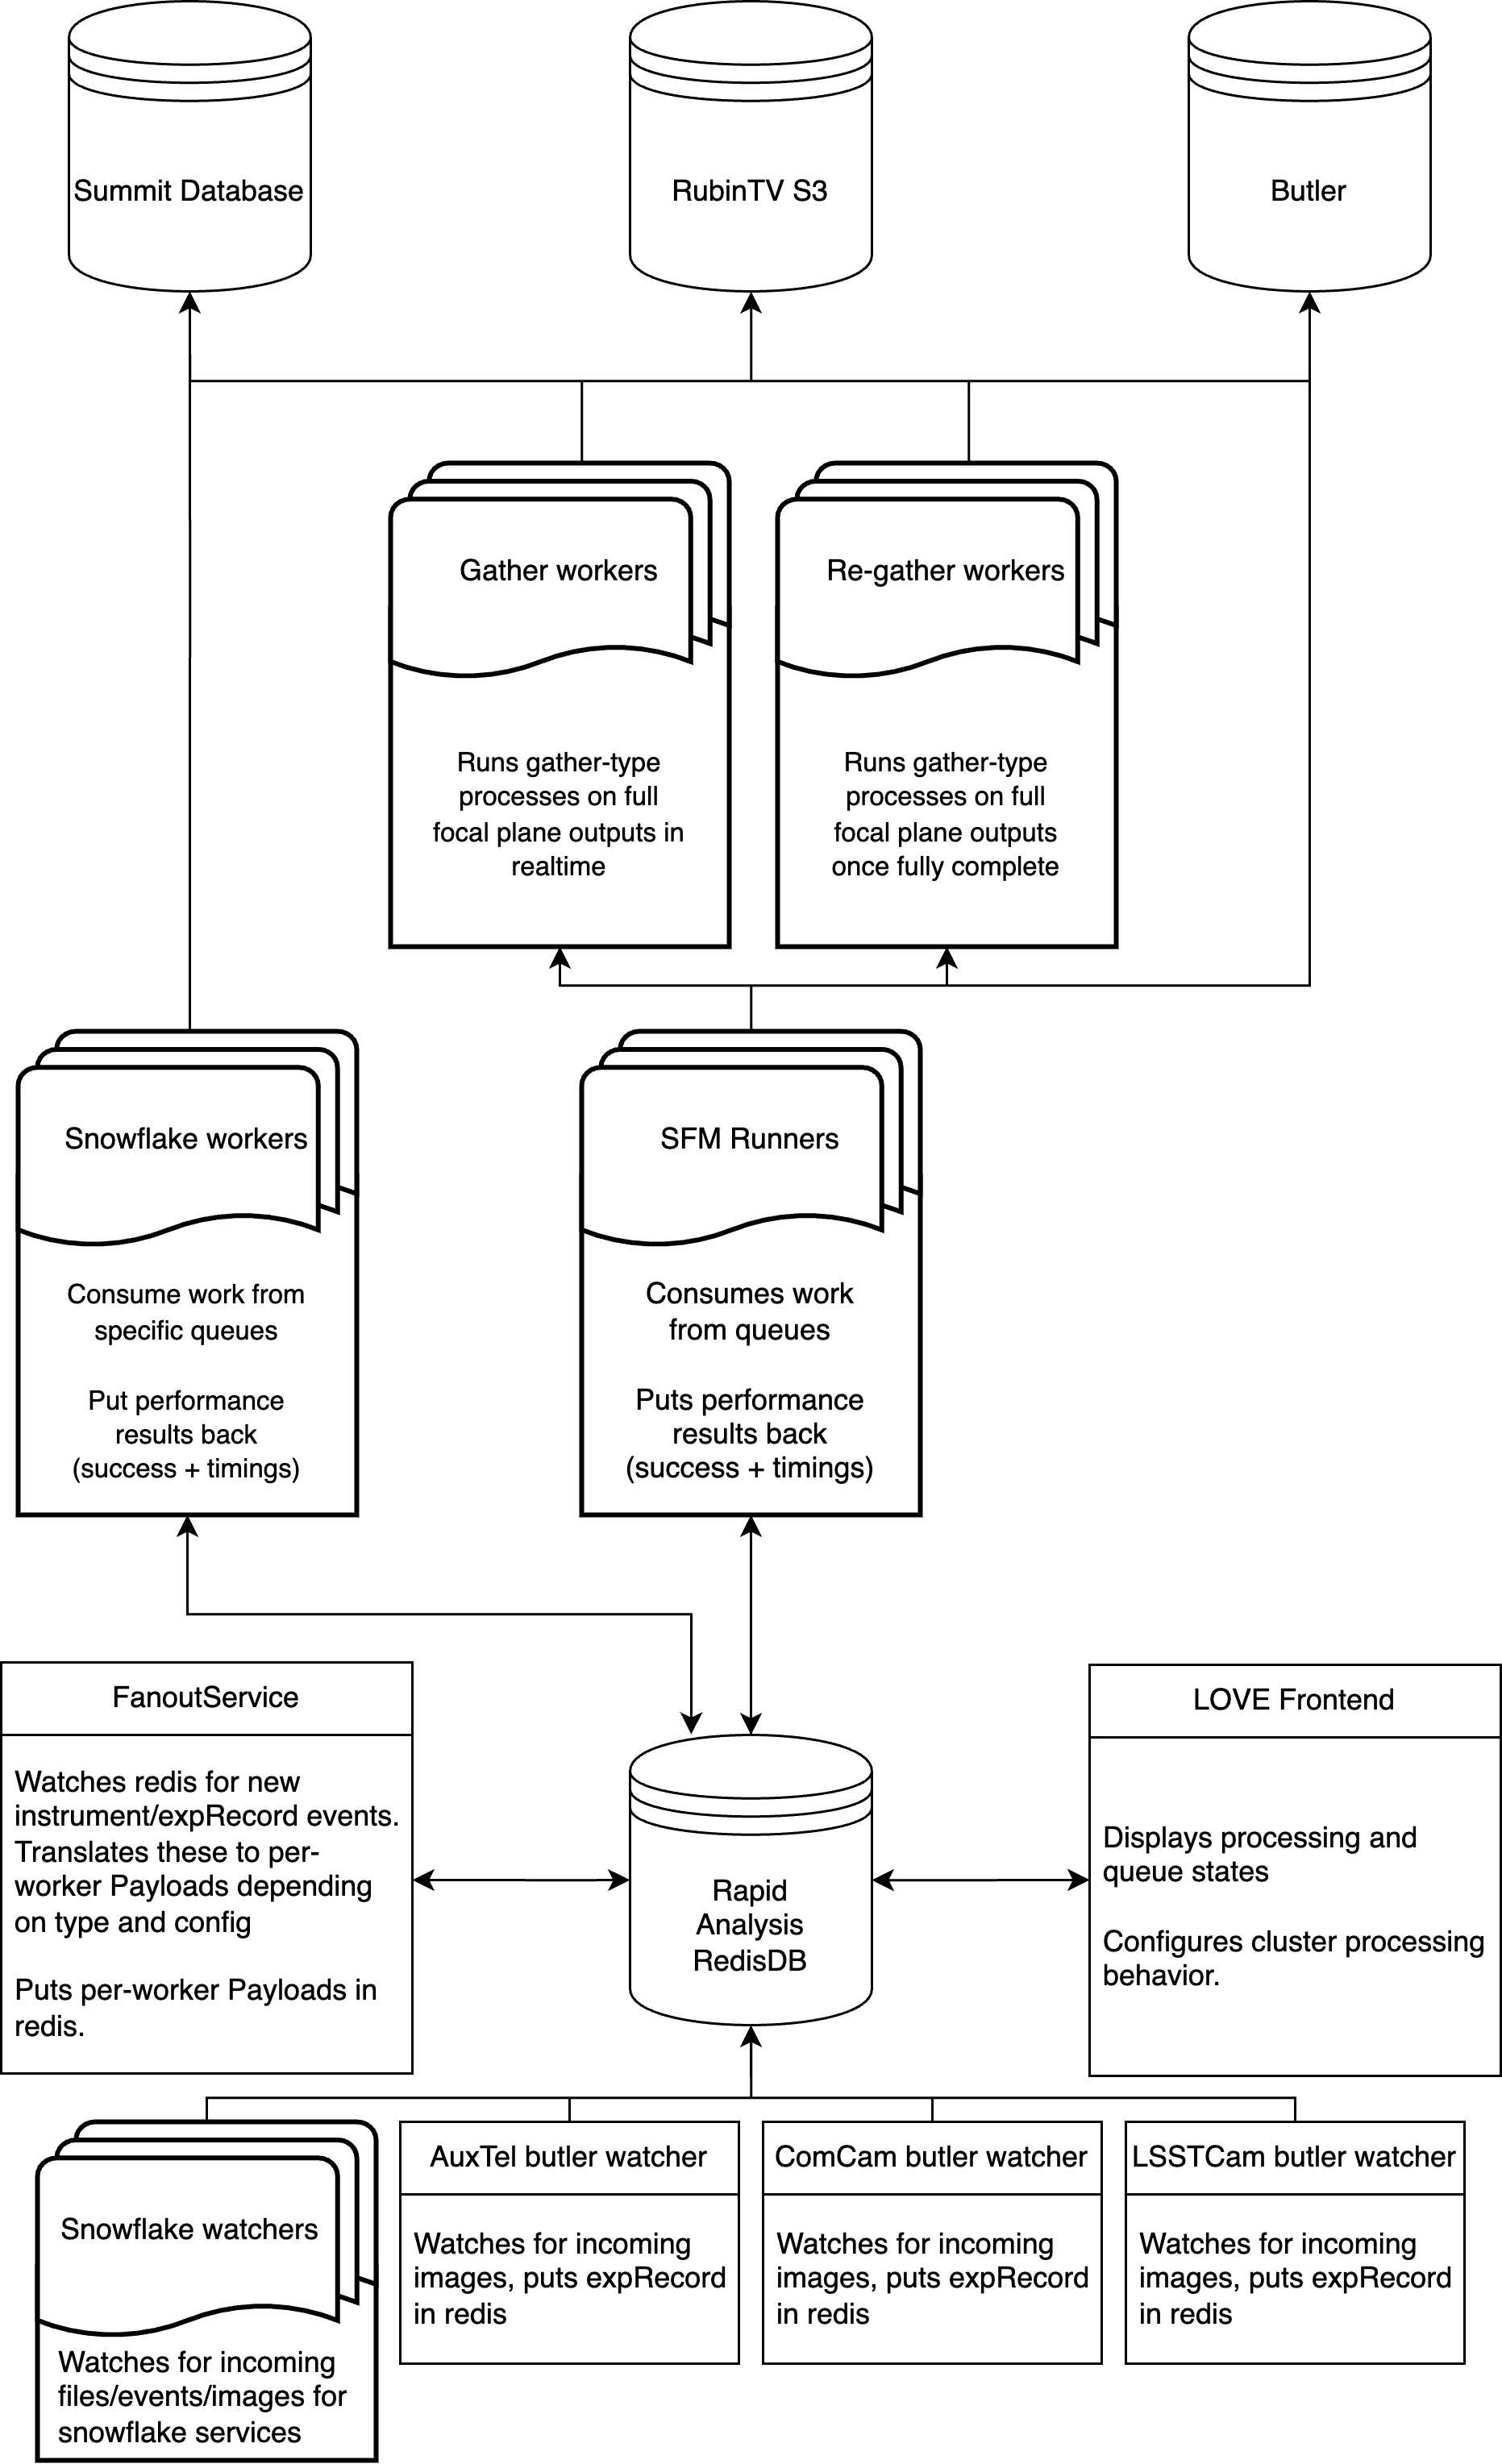
The diagram shows the high-level relationship between various system components. This is expanded on in the next section, but the high level design is: the various types of watchers watch for new images, events or files being created, and announce these to the head node, whose fanout then sends the work to the various types of workers, all of which is mediated by Redis. The snowflake workers run their pipelines, and output their results to the visit/summit database, RubinTV S3 and the summit butler. The fleet of SFM workers run the regular SFM pipeline on the detector images, and once the processing is complete, notify Redis that they have finished processing, at which point the visit-level (step1b) workers run any full focal plane visit-level processing, and the results are again written to all the locations shown. The workers report their status back to Redis, which RubinTV reads to display the overall cluster status, and RubinTV’s admin page in turn writes control commands back through Redis, giving observers high-level control over the cluster processing behavior (LOVE will eventually be able to display this status too).
How work is distributed and coordinated#
Everything in the diagram above is glued together with Redis, and it is worth spelling out how, because the same handful of patterns recur everywhere. There is no direct pod-to-pod communication anywhere in RA: every pod talks only to Redis, and the head node is the only thing with a global view.
The pieces are:
Watchers: a
ButlerWatcherpolls each instrument’s repo (currently once a second) for newly-landed raws and pushes them onto an incoming-exposure queue. Snowflake services which don’t go through the butler have their own watchers (a directory watcher for the all sky camera, aTMAEventMakerloop for the TMA, and so on) but the shape is the same: something notices new work and announces it to Redis.The head node: pops from the incoming queue, defines the visit, and fans the work out. For full focal plane processing this means creating one
Payload(a dataId plus a serialized pipeline graph) per enabled detector, and pushing it onto that detector’s worker queue.Detector affinity: each per-detector worker pod is permanently bound to one detector - the detector number is part of its Redis queue name - so the head node can send a given CCD’s work to the same pod every time, which is what makes in-process calib caching worthwhile. The system does not require affinity (pooled workers are also supported) but it is the default for SFM.
Pod health: every worker continually reasserts a short-lived “I exist” key in Redis (a heartbeat with a ~30s TTL) and sets an “I’m busy” flag while it is processing. The head node uses these to tell free, busy and dead pods apart without ever talking to a pod directly. This is also exactly the state which is surfaced on RubinTV’s detector-status page.
The one genuinely subtle bit is the trigger for the visit-level (step1b) step. Since each detector is processed independently and in parallel, something has to know when all of an exposure’s detectors are finished, so that step1b can run. This is done with a single per-exposure hash in Redis: at fanout time the head node writes the set of detectors it expects, and as each worker finishes it atomically writes back a “detector N finished” field. Every loop, the head node simply compares finished-against-expected, and when the set is complete it dispatches step1b. Failed detectors report themselves as finished-but-failed, so that a single dead CCD can’t wedge the whole focal plane, and the hash has a generous TTL so that if something goes badly wrong it self-cleans rather than blocking forever.
Snowflake Services#
- All sky images
A service (outside of RA) writes files to a fixed root path on disk at the summit, with the subdirectories named by the
dayObs. The all sky services monitors this path for new per-day directories, and once they exist, scans for new files, and each time one lands, re-stretches the PNG file to enhance the contrast, overlays the cardinal directions on it, overlays the time the image was taken, and sends it to S3 for display on RubinTV, as well as uploading it to the EPO GCS bucket for public display. Every 10 minutes, all images taken the on current day are animated, and the updated animation is sent to S3 for RubinTV display. These images are not ingested, and an obs_package does not exist for them, nor is there one planned, as far as I am aware. At the end of each day the temporary files are deleted and the final animation is sent to S3 for access in RubinTV via the all sky “historical” section for posterity.- StarTracker Image Processing
For every image taken by the three Star Tracker cameras (wide, narrow and fast) a
wcsis constructed from the image headers (including fixups), source detection is run, and an astrometric solution is found via a custom interface to astrometry.net (this is a local command line solve, not an web API call). The offset between the fittedwcsand the nominal TMA pointing is calculated, and the various WCS parameters and residuals with respect to the nominal pointing are sent to RubinTV for display. These images are not ingested, and a working obs_package does not exist for them.[7]
- Monitor Image Serving
For each new LATISS image, this service renders a
.pngof the post-ISR focal plane and sends it to S3 for display on RubinTV. It also pulls metadata from the image, and sends it to the LATISSMetadataServerfor dispatch to RubinTV (and, once this service is wired up to it, the Summit/Visit Database).- Metadata Servers
These are a long-standing workaround/crude substitute for the visit/summit database. Any running service can write a
metadataShardto a specific directory, with the directory being determined by which instrument it relates to. ThesemetadataShardsarejsonfiles which are named by thedayObsthat the data relates to, and contain one-or-more dictionaries of data, keyed byseqNum, containing one or more values for thatseqNum, i.e. one or more columns values for thatseqNum-row. These files are then collated and merged into a per-dayObsjsonfile, on a timer, by theMetadataServer. This allows any running service to asynchronously put one-or-more values into the table (i.e. enables partial row updates), with the value(s) simply updating the value(s) in the table. This makes partial, asynchronous, inter-process writes trivial, at the expense of having a proper database. These are the sources of truth for the tables on RubinTV.- Night Report Generation
This is a service which creates a selection of pre-defined plots throughout the night. Each time a new image is taken, all the plots are recreated and sent to RubinTV. There is an small framework which makes adding new plots very easy so that summit users/commissioning folk can easily add plots here to appear on RubinTV. It is possible that this will be deprecated/removed once the Derived Data Visualization work is done, but that remains to be seen, as it is possible there will still be a reason to have these made in a fixed and automatic way (for example, to add some plots automatically to observers’ end-of-night reports).
- Catchup Service
This is a custom-written service which finds gaps in the processing for various channels, and runs those images through their respective “pipelines” (not
pipelineTasks but the respective unit of work for a given instrument/image/channel). This is specifically used for catchup on snowflake services. For full focal plane processing there is no separate catchup mechanism: the per-worker queues themselves serve that purpose (see Catchup below).- ImageExaminer (service likely needs replacing)
For each new LATISS image, this service creates a
.pngcontaining some very quick (order of 1 second including i/o) canned analyses which are appropriate to run on all LATISS images, and sends it to S3 for display on RubinTV. This was a very quick and dirty service which was thrown together, and likely could do with a total rewrite now that other software has matured.- SpectrumExaminer
For each new dispersed (spectral) LATISS image taken, this service creates a
.pngcontaining a very quick (order of 1 second including i/o) “spectral reduction” and sends it to S3 for display on RubinTV. This provides realtime feedback for observers and scripts, providing a measurement of the main source signal level and the spectrum’s continuum flux in ADU/s so that exposure times can be adjusted dynamically.- AuxTel Mount Torque Analysis
For each LATISS image for which the mount was moving[8], the mount position and motor currents (torques) are pulled from the EFD for each of the three axes. The residuals from the nominal pointing are calculated, and the spurious mount motion RMS and its contribution to the delivered image quality are calculated. This metric is sent to RubinTV, along with a plot of the mount motion profiles and residuals. The mount performance metrics and image degradation numbers will be sent to the Summit/Visit Database once this service is wired up to it.
- TMA Event Generation
A
TMAEventMakeris run in a loop, such that every time the TMA moves, new events are generated from the EFD via theTMAStateMachine(see SITCOMTN-098 for the technical details onTMAEventgeneration). For each new TMA movement, various bits of telemetry are pulled from the EFD, and plots and metrics are created from them, and are sent to RubinTV for display (and will be sent to the Summit/Visit Database once this service is wired up to it).
Full Focal Plane Processing#
For the sake of simplicity, this section will only consider the summit, but note that similar systems are in place at all locations, with no real architectural differences, just different instruments’ data streams being processed.
It is worth noting that the fact that RA needs visit-level (step1b) steps makes it architecturally different to Prompt Processing. Prompt Processing, at least in terms of its realtime behavior, is entirely detector parallel - the only visit-level steps are run at the end of the night, whereas in RA, full focal plane metrics need to be computed constantly, in realtime, as the night goes, as well as generating things like full focal plane mosaic images for display in the control room. This therefore requires its own architecture.
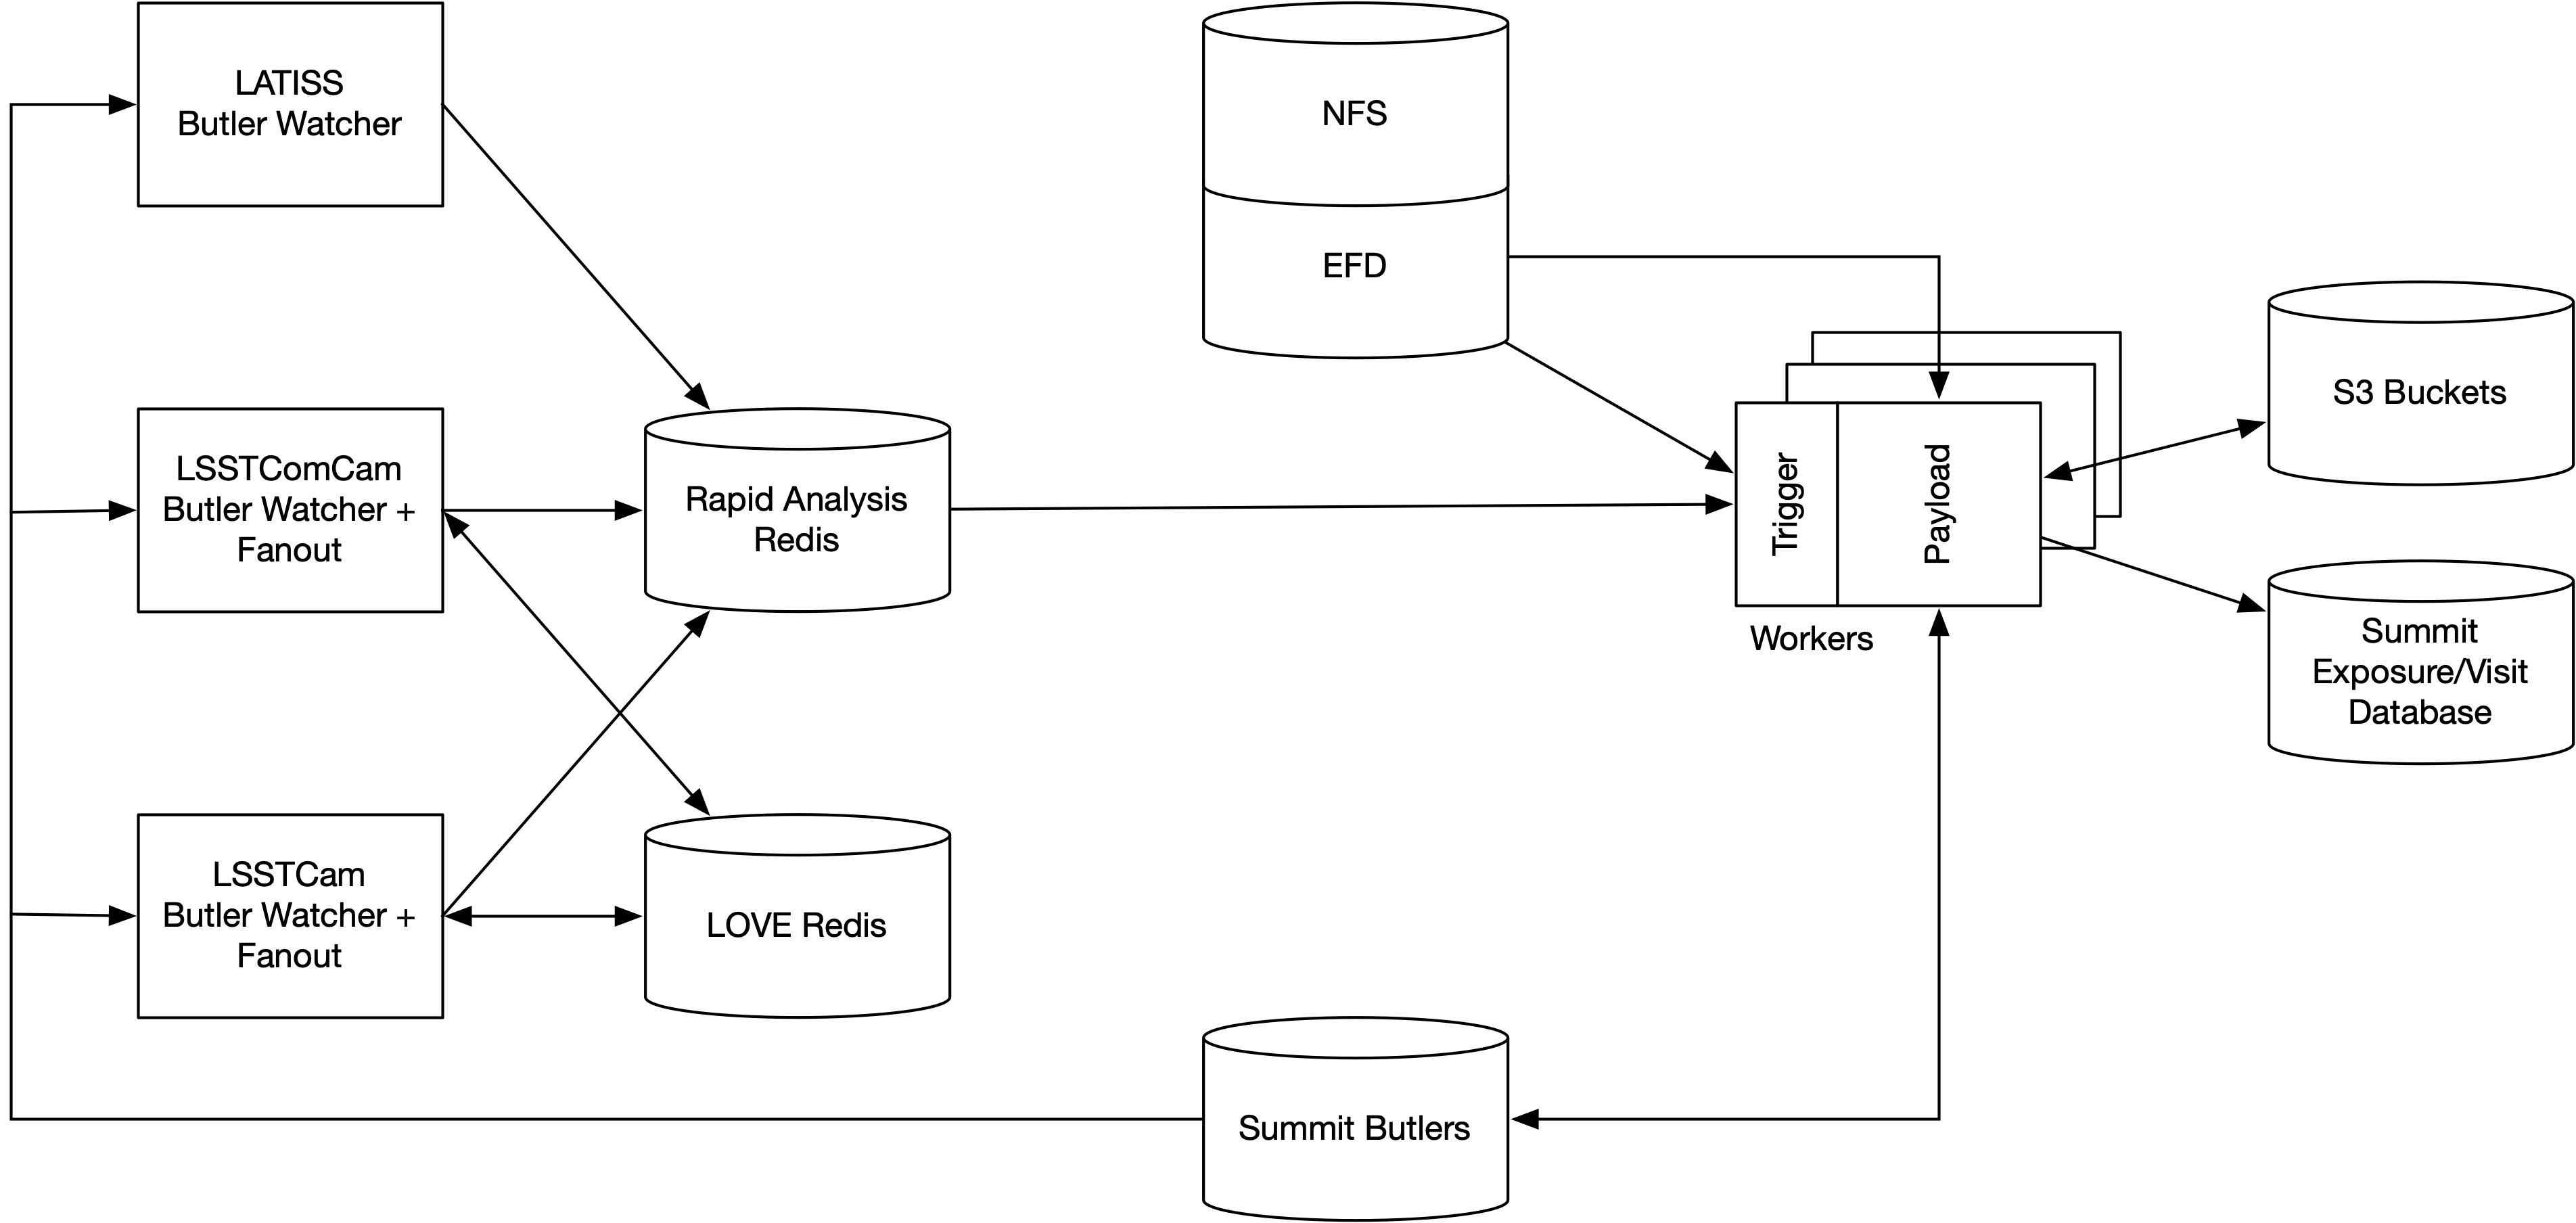
For each instrument (which on the summit will be, at some point, likely all of LATISS, LSSTComCam and LSSTCam simultaneously, due to cleanroom operation), the architecture is as follows:
Trigger: A head node watches for new data landing in the instrument’s repo[9], and dispatches this in a dynamic and configurable way to the worker nodes, as detailed in Processing Control.
Scatter (
step1a): This head node, via its detector-fanout logic (doDetectorFanout), sends the individual CCD-images to a pool ofSingleCorePipelineRunnerworker pods for processing through the normal DM Single Frame Measurement pipeline[10], in a scatter-type step. The per-detector work this fanout creates is what the pipelines code callsstep1a. This fanout and the workers themselves support detector affinity, in order to enable caching of calibs, but the system does not require pods to have detector affinity, i.e. it also supports generic pooled workers as well.Visit-level processing (
step1b): as each per-detector worker finishes itsstep1a, it writes a finished marker into Redis; the head node sees this and, as soon as every expected detector for an exposure has reported in, dispatches a visit-levelstep1bpayload to a dedicated visit-level worker. This is the step which aggregates the per-detector outputs into the full focal plane products. Failed detectors mark themselves as finished-but-failed in the same hash, so a single dead CCD can’t wedge the trigger - step1b just sees the failure in the set of inputs and proceeds.
The products which appear on the main LSSTCam page on RubinTV from full focal plane processing are:
witness_detector- a post-ISR image of one selected witness CCD, available as soon as that detector’s step1a has finished its ISR step (and so usually well before the rest of the focal plane has finished)focal_plane_mosaic- the binned post-ISR mosaic of the whole focal plane. This is dispatched as soon as every dispatched detector has produced its binned ISR image, which is independent of - and usually earlier than - the step1b triggercalexp_mosaic- the binned mosaic of the post-step1b calexps for the whole focal planepsf_shape_azel- full focal plane PSF shape plot (per-visit)fwhm_focal_plane- full focal plane FWHM plot (per-visit)imexam- per-detector quicklook ImageExaminer panelmount- mount tracking/torque analysis pulled from the EFD (the LSSTCam analogue of the AuxTel mount torque analysis)event_timeline- per-image timeline plotday_movie- a per-day movie assembled from the focal-plane mosaics over the night
All intermediate (non-butler) data products are written to a scratch area, and deleted after final use by step1b. Only the final outputs are kept, e.g. the calexps and visit tables etc are butler.put(), plots are sent to RubinTV S3, and metrics to the visit/summit database (ConsDB).
AOS (wavefront) processing#
The corners of the LSSTCam focal plane are not science CCDs but wavefront sensors, and these are handled by a parallel pipeline running on the same exposures as SFM. There are eight curvature wavefront sensors (CWFS), arranged as four intra/extra-focal pairs, one in each corner of the focal plane. On every on-sky science exposure the head node fans these eight detectors out to AOS_WORKER pods (separately from, and in addition to, the SFM fanout of the imaging detectors), where donuts are detected and Zernike coefficients estimated. There is then an AOS visit-level (step1b) step (the wavefront analogue of the SFM step1b described above) which aggregates the per-detector Zernike tables into a single wavefront estimate for the exposure.
There are two observing modes the pipeline has to cope with. In normal survey operation the wavefront information comes from the permanently-defocused corner sensors on an otherwise in-focus science image. In full-array mode (FAM), the whole camera is deliberately stepped intra- and extra-focal to take a dedicated defocused pair, and the analysis is done across the whole focal plane on that pair rather than on the corners. The pipeline detects which case it is in and builds the appropriate quantum graph, including the donut-pair merging needed to associate the intra- and extra-focal images of a pair.
A few things are worth calling out, because they make AOS architecturally different from “just another SFM-shaped service”:
It is paired. The two images of an intra/extra-focal pair have to be processed together, which means the control plane has to be careful not to, for example, switch the AOS pipeline configuration between the two images of a pair. There is an explicit interlock which rejects control commands arriving mid-pair (with a
REJECTED_BETWEEN_PAIR!read-back so that the observer can see it was deliberately ignored, rather than the system silently doing the wrong thing).The choice of donut-fitting algorithm (TIE vs Danish, paired vs unpaired, FAM vs not) is itself one of the runtime-selectable pipeline configurations driven from RubinTV’s admin page.
Unlike almost everything else in RA, the AOS results are not purely for human consumption: the wavefront results are reported onward to MTAOS (the active optics control loop) so that they can feed back into the telescope’s optical state. The plots and Zernike pyramids still go to RubinTV for situational awareness, and the summary numbers to ConsDB, as everywhere else.
The products which appear on the LSSTCam AOS page on RubinTV are:
fp_pairing_plot- focal plane plot showing which intra/extra-focal donut pairs were associatedfp_donut_gallery- gallery of cut-out donut images, per CWFSzk_measurement_pyramid- per-detector measured Zernike coefficient pyramidzk_residual_pyramid- residual Zernike pyramid after the fitted optical state has been subtractedpsf_zk_panel- combined panel of PSF metrics and Zernike measurementsdonut_fits- the fitted donut images themselvesfocus_sweep- results from focus-sweep observations (run by theFOCUS_SWEEP_ANALYZERpod on OCS command, not on every exposure)zernike_predicted_fwhm- FWHM predicted from the measured Zernike coefficientsdof_predicted_fwhm- FWHM predicted from the degrees-of-freedom solution
Guider processing#
The remaining non-science detectors are the guider sensors. These are read out continuously during an exposure rather than once at the end, and a dedicated GUIDER_WORKER turns those reads into the guider products shown on the LSSTCam guider page on RubinTV. There is no separate visit-level step1b step here - it is a per-exposure, single-worker job - but it is dispatched by the same head node off the same exposure record as everything else, so it is mentioned here for completeness rather than because it is architecturally novel.
The products which appear on the guider page are:
full_movie- a movie of the full guider field readouts through the exposurestar_movie- a per-star movie of the guider stamps through the exposurecentroid_alt_az- guider centroid motion in alt/azflux_trend- per-star flux trend through the exposurepsf_trend- per-star PSF trend through the exposure
Processing control#
Full focal plane processing behavior is both dynamic and configurable: it is dynamic, in that it can automatically down-select which images are processed based on the image acquisition rate and how well the cluster is keeping up. The behavior for when we are not perfectly keeping up is configurable at runtime via RubinTV’s admin page, which writes control commands to Redis that the head node consumes[11]. (LOVE may eventually be able to drive this too, but the operative control plane today is RubinTV.)
Dynamic focal plane selection#
Note: at the time of writing, this dynamic down-selection is not actually being used anywhere. We are processing the full focal plane on every image, and have not (yet) needed to drop to a sparser pattern in practice. Everything below is implemented and tested, but is currently moot - this is the mechanism that will kick in if and when acquisition rate and pipeline timings make full coverage impossible, not something that is shaping current operations.
Work distribution proceeds from the head node, to the workers, via redis. The head node’s fanout allocates work based on the current CameraControlConfig’s selection of CCDs and whether the processing is keeping up. There are many modes of operation one could imagine, and the code has been written to allow for arbitrary selections, but to paint a picture of a few scenarios which it is already setup to support:
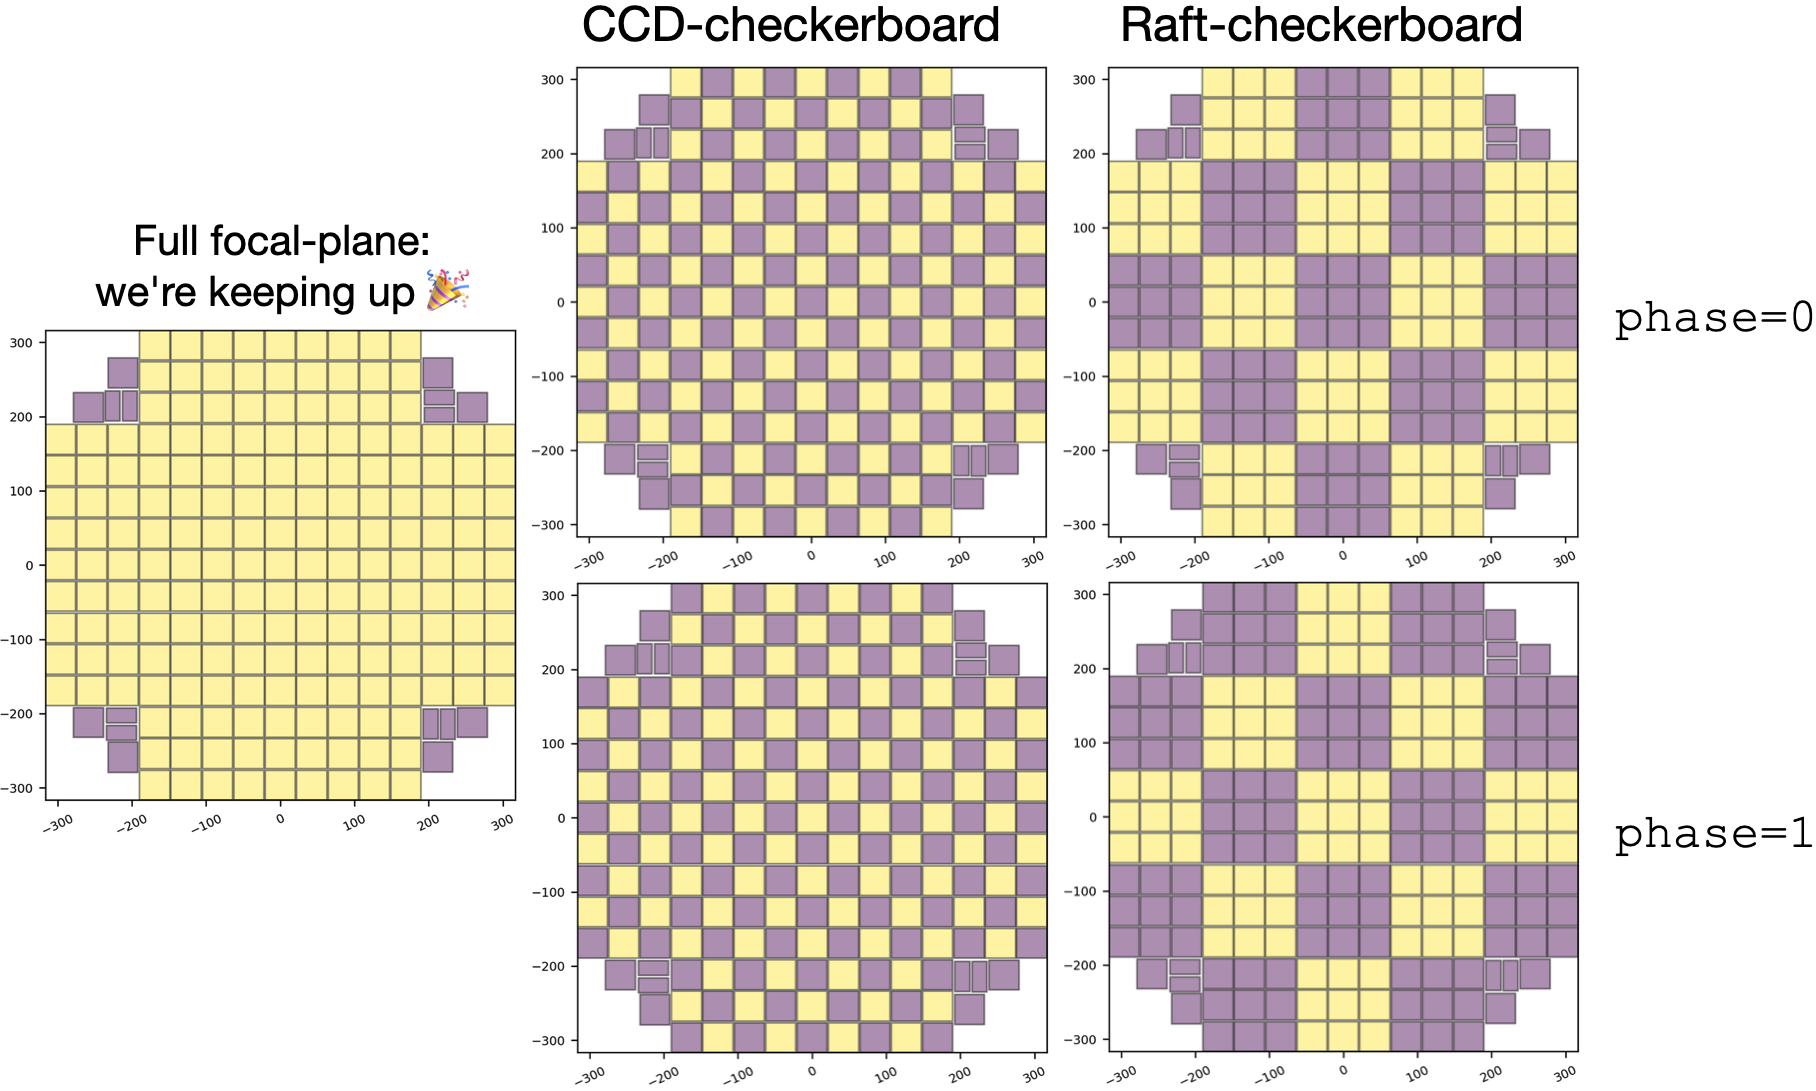
We keep up: every image has the full SFM pipeline run on every science detector - the focal plane is complete.
CCD-checkerboard: in order to keep up, we select ~half of the CCDs in order to keep full area coverage but at half load.
Raft-checkerboard: we similarly down-select, but at the raft level. This gives more continuity at small scales at the expense of worse spatial sampling of the focal plane.
Arbitrary patterns: any pattern you can image can be selected (spirals, rings, crosses, e2v/ITL-only etc), and these can be predefined, or selected at runtime from RubinTV’s admin page in the control room.
For a given pattern, one can imagine several modes in which the pattern varies with time, too, which again, are selectable at runtime via the same RubinTV control interface:
fixed: the selected pattern persists while we are unable to keep up.alternating-phase: the phase of the checkerboard pattern flips between images to ensure we don’t always process some detectors while ignoring others.alternating-by-twos: the phase of the checkerboard pattern flips every other image, such that we still ensure we don’t always process some detectors and ignore others, but also ensures that we always have always processed consecutive exposures on a given CCD, for easier comparison.id-guaranteed: for a specific exposure id, process the entire focal plane regardless of whether it will cause us to fall a little behind while processing takes place. This would be useful for ensuring that scientists will have all the relevant data products for an image that was taken for a specific reason.Any other behavior you can dream of programatically.
Processing modes#
It is also possible to determine the behavior of the workers themselves. Currently, two modes are implemented, with a third envisioned but not yet really technically devised.
WAITING: Each detector’s pod sits and waits for the next image to land. Once one is available, SFM runs to completion,butler.put()ing the resulting calexp as well as writing out some intermediate metadata shards which are collated and sent to RubinTV, with the corresponding summary statistics being written to the Summit/Visit Database (ConsDB). Once the processing is finished, the pod waits and does not process any images in the backlog queue, waiting for a new image to land.CONSUMING: Each detector’s pod processes its most recent detector image as perWAITING, but if, once finished, a new image has not landed, the most recent image on the backlog queue will be processed, continually, until a new image lands.MURDEROUS: This is a best-of-both-worlds hybrid ofWAITINGandCONSUMINGwhere the most recent image is always let to run to completion, but if the image in progress came from the backlog queue and a new image lands while processing is not yet finished, progress is abandoned and the image is put back on the backlog queue. This mode does not yet exist.
The WAITING mode has the least latency, but means compute sits idle, whereas CONSUMING mode ensures that the compute is always working (while there is work to do), but means that new images will not start for the balance of the in-progress SFM pipeline, which can be up to ~60s. MURDEROUS would be a best of both worlds hybrid, but is non-trivial to implement. Other modes of operation including pooled workers (both with and without detector affinity) are also being considered, but a concrete answer as to the number of available cores is needed to inform the best approach there.
Catchup#
There is no dedicated catchup mechanism for full focal plane processing. When the cluster falls behind, payloads simply accumulate on the per-detector worker queues, and workers in either WAITING or CONSUMING mode (above) work through whatever is there in their own time. Once the acquisition rate drops below the processing rate - which in practice means as soon as there is any pause in image-taking, and certainly by the end of the night - the backlogs naturally burn down and everything queued gets processed. There is no need for a separate catchup service in the way the snowflake services have one, because the work queues themselves are the catchup mechanism.
Miscellaneous services#
There are a handful of additional standalone pods running alongside the main image-processing pipeline which don’t really fit into the snowflake or full focal plane categories - they exist to keep the cluster healthy, observable, controllable and tidy. They are mostly small, but they are operationally important.
- Cluster status, rebalancing and worker resets
The
ClusterManagerruns as its own pod and is the thing which makes the cluster observable and controllable from RubinTV. On a continuous loop it does three things. First, it queries the state of every worker pod via the+EXISTS/+IS_BUSYRedis flags described in How work is distributed and coordinated, and publishes the result onto a set of Redis streams (CLUSTER_STATUS_SFM_SET_0,CLUSTER_STATUS_AOS_SET_0, and so on) which RubinTV’s detector page reads to render the per-detector status grid - this is the source of the green/red/grey indicators observers see. Second, it rebalances: if some SFM workers have a backlog of detector payloads queued while others are idle, it moves payloads off the busy pods onto free backlog or otherwise recruitable workers, so that detector affinity does not turn into a hard load imbalance when a particular detector pod gets unlucky. Third, it consumes a separate family ofRUBINTV_CONTROL_RESET_*Redis keys, set from RubinTV’s admin page, and dispatches aRestartPayloadto every pod in the addressed worker set, which is how operators graceful-restart a worker group from the control room without having to redeploy anything.- Performance monitoring
RA self-monitors. The
PerformanceMonitorpod walks through completed exposures and pulls per-step timing information out of the Redis tracking hashes, writing the per-task durations out as metadata shards. ATimedMetadataServerthen collates those shards and uploads them to S3 as thera_performancechannel on RubinTV, so that the developers (and anyone else who is curious) can see how long each pipeline step is actually taking, where the bottlenecks are, and whether the cluster is keeping up. This is exactly the same shard mechanism described under Metadata Servers; the only difference is that it is pointed at RA’s own internal timing data rather than at image data.- Butler responsiveness watchdog
butlerCanaryis a tiny, deliberately dumb pod which sits in awhile Trueloop callingbutler.get("raw", ...)for each of the 189 detectors of the most recent LSSTCam exposure, sleeping a minute between calls, and logging the duration of everyget. It does nothing with the data and produces no plots: it exists purely to give us a continuous, independent measurement of how long a butler read of a raw is currently taking. If butler reads start getting slow (which has happened historically, and which when it does will silently degrade everything downstream), this is the canary which surfaces it.- Daily cleanup and bucket sync
The cleanup pod (
TempFileCleaner) runs on an astronomical clock. At sunrise it kicks off the fixed daily chores: deleting the on-disk pixel-product directories that were used as scratch during the night, deleting the corresponding scratch areas in S3, and running a bucket sync which pushes any objects in the local (summit) S3 bucket which didn’t make it to USDF during the night up to USDF, bringing the USDF mirror back into alignment with the summit[12]. Once the chores are done, for the rest of the day until sunset, the pod runs a throttled “cleanup pass” which works through old quicklook-style butler datasets (isr_metadata,preliminary_visit_image_background, the various binned ISR products, and so on - the full list lives inDATASETS_TO_CLEANincleanup.py) and deletes anything older than the retention window. After sunset it sleeps until the next sunrise. The set of datasets considered ephemeral by this pod is curated by hand, on the principle that anything which is small or trivially regeneratable should be cleaned and anything large, expensive to recompute, or directly useful to scientists should not.
Notes#
Development workflow: git-pull on pod start#
Note: This is not a feature of the framework itself. This is the current state of play, and something I have found to be pragmatic, an extremely quick and low-friction workflow, and has not yet resulted in any disasters, and has allowed for hotfixes which are both mentally easier and orders of magnitude faster. I am, however, very very open to other, better ideas here!
It is very common to want to hotfix things on the summit, either to quickly deploy bug fixes, or to push out new features in realtime (and often both, where new features are being developed and debugged as part of their development). Currently, the way this is done is by having a small, pre-selected set of eups managed DM packages which git pull from a deploy-summit branch on pod startup, as changes here really only touch a few parts of the codebase in practice. The main downside here is that these branches must be kept compatible with the base image or the service will fail, and while this is not hard for experts, it does require some breadth of knowledge and care to be taken. It does, however, have has several advantages to a more traditional development workflow.
Normally, this would be done with a full pod rebuild, but this is slow (at least 30 minutes, I think). Not only is the pod build slow, but the image pull is then also slow for new images (often around 10 minutes), and hotfixes often want to be much much faster than either of these, let alone their sum. Then there is the fact that it is not always possible to fully test things before pushing, meaning it’s not all that uncommon to need to iterate a few times (and when things are already broken it’s OK to push a non-working fix because you’re already dead in the water).
Techdebt#
There are several places where Rapid Analysis has significant tech debt. Some of it is minor, but ugly and just in need of a tidy-up because it was done in a hurry, but some of it is deeper and a risk to ongoing stability and maintenance, and hinders development.
Minor:
LocationConfig: This is honestly just pretty gross. It is not a hard fix, but it does need doing.Package (and some file) renaming. Need to finally deal with the hangover of
rubintv_productionetc.Some channels are just a bit ugly/hacky because they were written in a hurry and then ignored once they worked. They’re only the low priority ones though, e.g. all sky camera.
Major:
Test coverage - both unit tests and CI testing: The test coverage is frankly shocking - it is currently about 25%. This not only makes development harder and more scary, but hinders larger, more refactoring-like work, and thus causes a vicious circle, with the debt compounding as the lack of tests makes tidying up itself more difficult.
RA pod build system and devOps work: It may well be that there’s no real tech debt here, it may just need more FTEs. Basically it just needs to be so that it doesn’t need to be done me and Tiago (though I think Sebastian might be able to help here, now).
The implicit, unenforced RA↔RubinTV contract - see below.
The implicit RA↔RubinTV contract#
As described in The boundary between RA and RubinTV, the entire coupling between the two systems is a pair of conventions: S3 object key naming, and Redis key naming. Both of these are maintained independently in two repos, with no shared schema, no shared package, no contract tests, and no enforcement of any kind. The failure modes that follow from this are all silent:
If RA renames a channel (and therefore the S3 key prefix it writes to) without a coordinated change in RubinTV, RubinTV will simply stop showing that channel. There will be no error, no warning, and no test failure - the data will just stop appearing on the page, and a human will eventually notice that something is missing.
If RubinTV’s admin page is updated to write to a
RUBINTV_CONTROL_*key that RA does not consume (a typo, a stale rename, a new control on one side but not the other), RA will silently ignore it. The read-back will appear to succeed (the value will be set in Redis), but nothing on the RA side will respond to it, and again the only feedback will be a human noticing that the control no longer does anything.If RA changes the shape of its cluster-status streams, or the value semantics of any
_READBACKkey, RubinTV’s detector page or admin readback will silently regress - colours will go wrong, statuses will show as “unknown”, confirmations will look stuck.AOS pipeline names (
AOS_DANISH,AOS_TIE, etc.) and chip-selection pattern names (raft_checkerboard,ccd_checkerboard, etc.) are hardcoded as plain strings on both sides. A rename on either side without a matching change on the other will result in either rejected controls, or - worse - the wrong pipeline silently running because the control was accepted but interpreted differently.
The reason this has worked so far is that the set of people working on either side of the boundary is small enough that we stay coordinated by talking to each other, not because the system enforces anything. As the project grows, and as the number of channels and Redis controls grows, this becomes more and more obviously a risk, and at some point it will bite us.
Plausible fixes include: a shared schema package imported by both sides which defines the canonical names of channels, Redis keys, and pipeline/pattern identifiers; contract tests in CI which check that every RubinTV-known channel/key has a producer on the RA side and vice versa; or, at the very least, a single source-of-truth document for channel and Redis key names which both sides reference in code. None of this exists today.